Markets
Ripple (XRP) Price Breaks Above Resistance

Ripple (XRP) price has been steadily falling since it closed at a yearly high of $0.72 on March 11. The token’s price has dropped 7% in the past month.
This recent decline has led to the formation of a descending triangle that sees the seventh largest cryptocurrency by market capitalization now try to get out of.
Ripple moves towards resistance
At press time, XRP was at $0.48. It was trading near the upper line of its descending triangle, which has been forming resistance since May 22.
A descending triangle is a bearish pattern that forms when the price of an asset makes a series of lower highs while maintaining a relatively flat support level.
When the price of an asset attempts to break above the upper trend line of this triangle, which forms a resistance level, it indicates a potential bullish breakout. If the breakout is accompanied by an increase in trading volume, it confirms a possible trend reversal from bearish to bullish.
XRP has seen a surge in daily trading volume in recent days. In the last 24 hours, the altcoin’s trading volume totaled $775 million, a spike of over 30%.
To know more: How to Buy XRP and Everything You Need to Know
Ripple Trading Volume. Source: Holiness
Additionally, its weighted sentiment has turned positive for the first time since June 21. This metric tracks the overall market sentiment around an asset. It takes into account the sentiment surrounding the asset and the volume of discussions on social media.
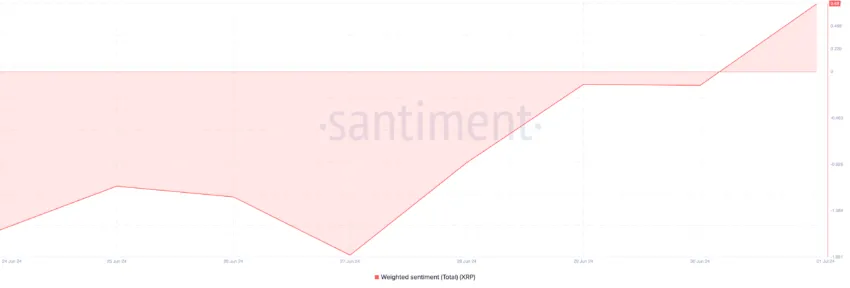

When it goes from negative to positive, it suggests a change in market sentiment from bearish to bullish. As of press time, XRP the weighted sentiment is 0.68.
XRP Price Prediction: Buyers and Sellers Are Fighting
As XRP begins to recover, readings from its MACD (Moving Average Convergence/Divergence) indicator reveal that a bullish crossover between the MACD line (blue) and the signal line (orange) occurred on June 30.
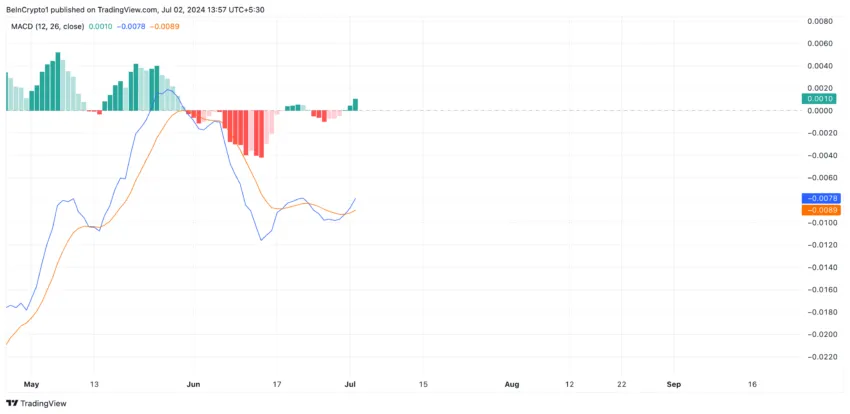

This indicator measures the price trends of an asset and identifies potential buy or sell signals. When the MACD line crosses the signal line in an uptrend, it is bullish. Traders often interpret this as a buy signal, as the short-term average of the asset is rising faster than its long-term average.
If XRP’s weighted sentiment remains positive and demand for the altcoin continues to rise, its price could rise to $0.49.
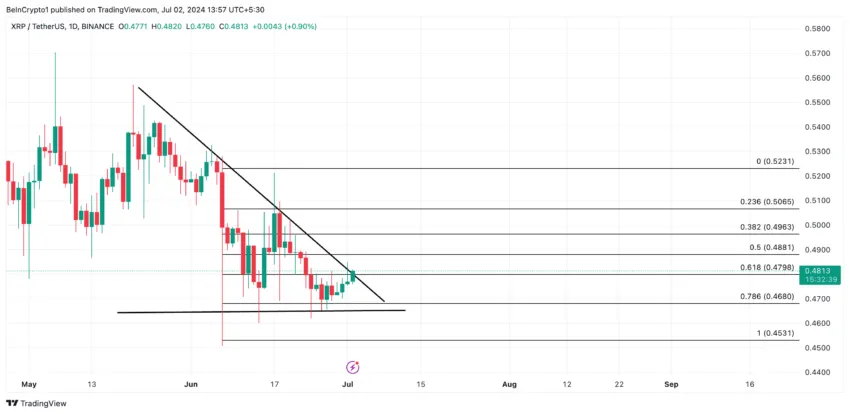
However, if it fails to overcome the resistance and falls back inside the triangle, the above projection is invalidated and will trade at $0.47.
Disclaimer
In line with the Trust Project guidelines, this price analysis article is for informational purposes only and should not be considered financial or investment advice. BeInCrypto strives to provide accurate and unbiased reporting, but market conditions are subject to change without notice. Always conduct your own research and consult a professional before making any financial decisions. Please note that our Terms and conditions, Privacy PolicyAND Disclaimers They have been updated.