Markets
Reasons Why the Cryptocurrency Market Dropped Today

With a 2% decline in global market capitalization, today marks a slow day for the cryptocurrency sector. As of now, the overall cryptocurrency market capitalization has dropped to $2.55 trillion after rising to $2.63 trillion previously. Furthermore, most cryptocurrencies are colored red in the heat map, confirming the market decline.
In the last 24 hours, Bitcoin price decreased by 3%, Ethereum price it lost 3% of its gains despite excess demand for the Ethereum ETF, and the rest followed suit. So, what was behind this fall? Let’s talk about it in this blog.
Why was the cryptocurrency market down today?
After bullish market conditions in March, the cryptocurrency market declined until recovering a few days ago. Market sentiments have also shifted from neutral to greedy indicative of fear and greedbut the decline pierced the bullish possibilities.
Mainly there were two reasons behind this decline; Mt Gox Bitcoin Transfer and Declining Bitcoin ETF Inflows. Let’s examine it.
Mt Gox transferred $9 billion worth of BTC
After almost 10 years of closure, Mount Gox, a popular cryptocurrency exchange at the time, made a transfer of 141,686 BTC ($9.3 billion in BTC) to three unknown wallets. This transfer is an attempt to return money to investors who lost their funds during the 2014 hack. However, these BTC worth $9 billion represented a huge amount, causing panic among cryptocurrency investors instead of relief for transfers.
Today, #MtGox moved all 141,686 $BTC($9.63 billion) to 3 new wallets and all 142,846 $BCH($66.4 million) in a new portfolio.
These transfers are in preparation for refunds.
The refund deadline is October 31, 2024.https://t.co/amB6lnQXtf
New wallets:https://t.co/Lw9fpadxEj… pic.twitter.com/mX5CZrhYvH
—Lookonchain (@lookonchain) May 28, 2024
The transfer took place in 13 parts, with the destination being the three anonymous addresses. The transactions ranged from $3 billion to $2.2 billion in BTC, causing the price of BTC to drop to $67,918.13 from its peak of $70,000, causing overall selling pressure in the cryptocurrency market.
Additionally, Mt Gox became the 11th largest BCH cryptocurrency address as one of its wallets moved 142,846 BCH tokens (worth $69.7 million) to an unflagged address.
Bitcoin ETF inflows have become stationary
The Bitcoin ETF remains steady after witnessing huge demand earlier in the month. Currently, the BTC ETF inflow rate is limited to $13.68 billion for the third consecutive day, slowing the market growth. This comes after surpassing a ten-day record of increases in ETF inflow data through the 25th, when recorded net inflows were $252 million. It points to growing investor concerns about short-term gains in the cryptocurrency market.
US-based Bitcoin spot ETFs have seen their highest net inflows in the past week since mid-March. pic.twitter.com/Z1yJIkQsyB
— Mads Eberhardt (@MadsEberhardt) May 27, 2024
However, investors are still bullish despite the cryptocurrency market crash Ethereum ETF approved plays the most significant role. With the discussion on upcoming ETF projectstraders are watching the altcoin rally with anticipation of an early bull run.
Keep reading Best Cryptocurrencies to Buy Under $2 to Make Millions

Bitcoin AND Etherealalong with the rest of the top 10 cryptocurrencies by market cap, appear to be in hibernation on Thursday morning.
At the time of writing, the Bitcoin Price is still below $65,000 and 2.2% lower than it was this time yesterday, according to CoinGecko data. Things are worse for the Ethereum Pricewhich is 3.7% lower than 24 hours ago at $3,185.22. The drop in ETH’s price is identical to that of Lido Staked Ethereum (stETH), a liquid staking token for Ethereum.
In recent days, falling prices have led to the liquidation of derivative contracts worth $225 million, according to Coin glassAnd about half of that, about $100 million, was liquidated in the last 12 hours.
When a trader is liquidated, it means that their position in the market has been forcibly closed by an exchange or brokerage due to a margin call or insufficient collateral. Margin is especially important when it comes to leveraged positions, which allow traders to control a multiple of their deposit, such as opening a $10,000 position with only $1,000 in their account.
Now that Bitcoin has been in the red for three days in a row, there is a chance that the world’s oldest and largest cryptocurrency could sink even further, BRN analyst Valentin Fournier said in a note shared with Decrypt.
“Bitcoin has closed in the red for three days in a row, with one-way trading showing limited resistance from bulls. Ethereum had a slightly positive Monday with strong resistance from bears who have won the last two days,” he wrote. “This momentum could take BTC to the $62,500 resistance or even the $58,000 territories.”
Looking ahead, Fournier said BRN’s strategy will be to “reduce exposure to Bitcoin and Ethereum and find a better entry point after the dip.”
This is despite Federal Reserve Chairman Jerome Powell’s comments yesterday on interest rates being widely regarded as accommodating and indicative of FOMC rate cuts in September.
Singapore-based cryptocurrency trading firm QCP Capital said the rally in stocks, which sent the S&P 500 up 1.6% from Wednesday’s close, was not felt in cryptocurrency markets.
“Cryptocurrencies have seen a broad sell-off overnight and into this morning,” the firm wrote in a trading note. “The market remains poised as traders pay close attention to daily ETH ETF outflows and further supply pressure from Mt Gox and the US government.”
Meanwhile, the other top-ranking coins are showing mixed performance.
Solana (SOL) is down 7.2% since yesterday to $169.13. Things are even worse for its most popular meme coins. In the past 24 hours, the most popular meme coins Dogwifhat (WIF) are down 12% and BONK (BONK) is down 9%, according to CoinGecko data.
Their dog-themed competitor, Ethereum OG Dogecoin (DOGE), the only meme coin in Coingecko’s top 10, is down nearly 4% since yesterday and is currently trading at $0.1205.
XRP (XRP) dropped to $0.608, which is 7% lower than it was at this time yesterday.
Binance’s BNB Coin (BNB) has kept pace with BTC and is currently trading at $571, down 2.4% from yesterday. Toncoin (TON), the native token of The Open Network, is down just 0.4% over the past day.
This leaves the stablecoins USDC (USDC) and Tether (USDT), both of which are stable as they maintain their 1:1 ratio with the US dollar.

The Securities and Exchange Commission (SEC) will hold another closed-door meeting with Ripple on Thursday, as the market hopes for a possible resolution to the legal battle between the two entities.
However, the cryptocurrency market remains relatively bearish, with the price and trading volume of XRP down in the last 24 hours.
Ripple holders take no risk
At press time, XRP is trading at $0.60. The altcoin’s price has dropped 6% over the past 24 hours. During that time, trading volume was $27 million, down 27%.
The SEC met before with the digital payment company on July 25. While the outcome of that meeting remains unknown, the Sunshine Act Notice for Thursday’s meeting includes one additional topic of discussion from the July 25 closed meeting: the instituting and resolving injunctive relief. That has market participants speculating whether a settlement is imminent.
In an exclusive interview with BeinCrypto, Ryan Lee, Lead Analyst at Bitget Research, noted that:
“This meeting will discuss possible resolution options for the Ripple Lawsuit. The founder of Ripple Labs said that a legal settlement could be announced soon. If an official settlement plan is released, it could positively impact XRP’s price movement.”
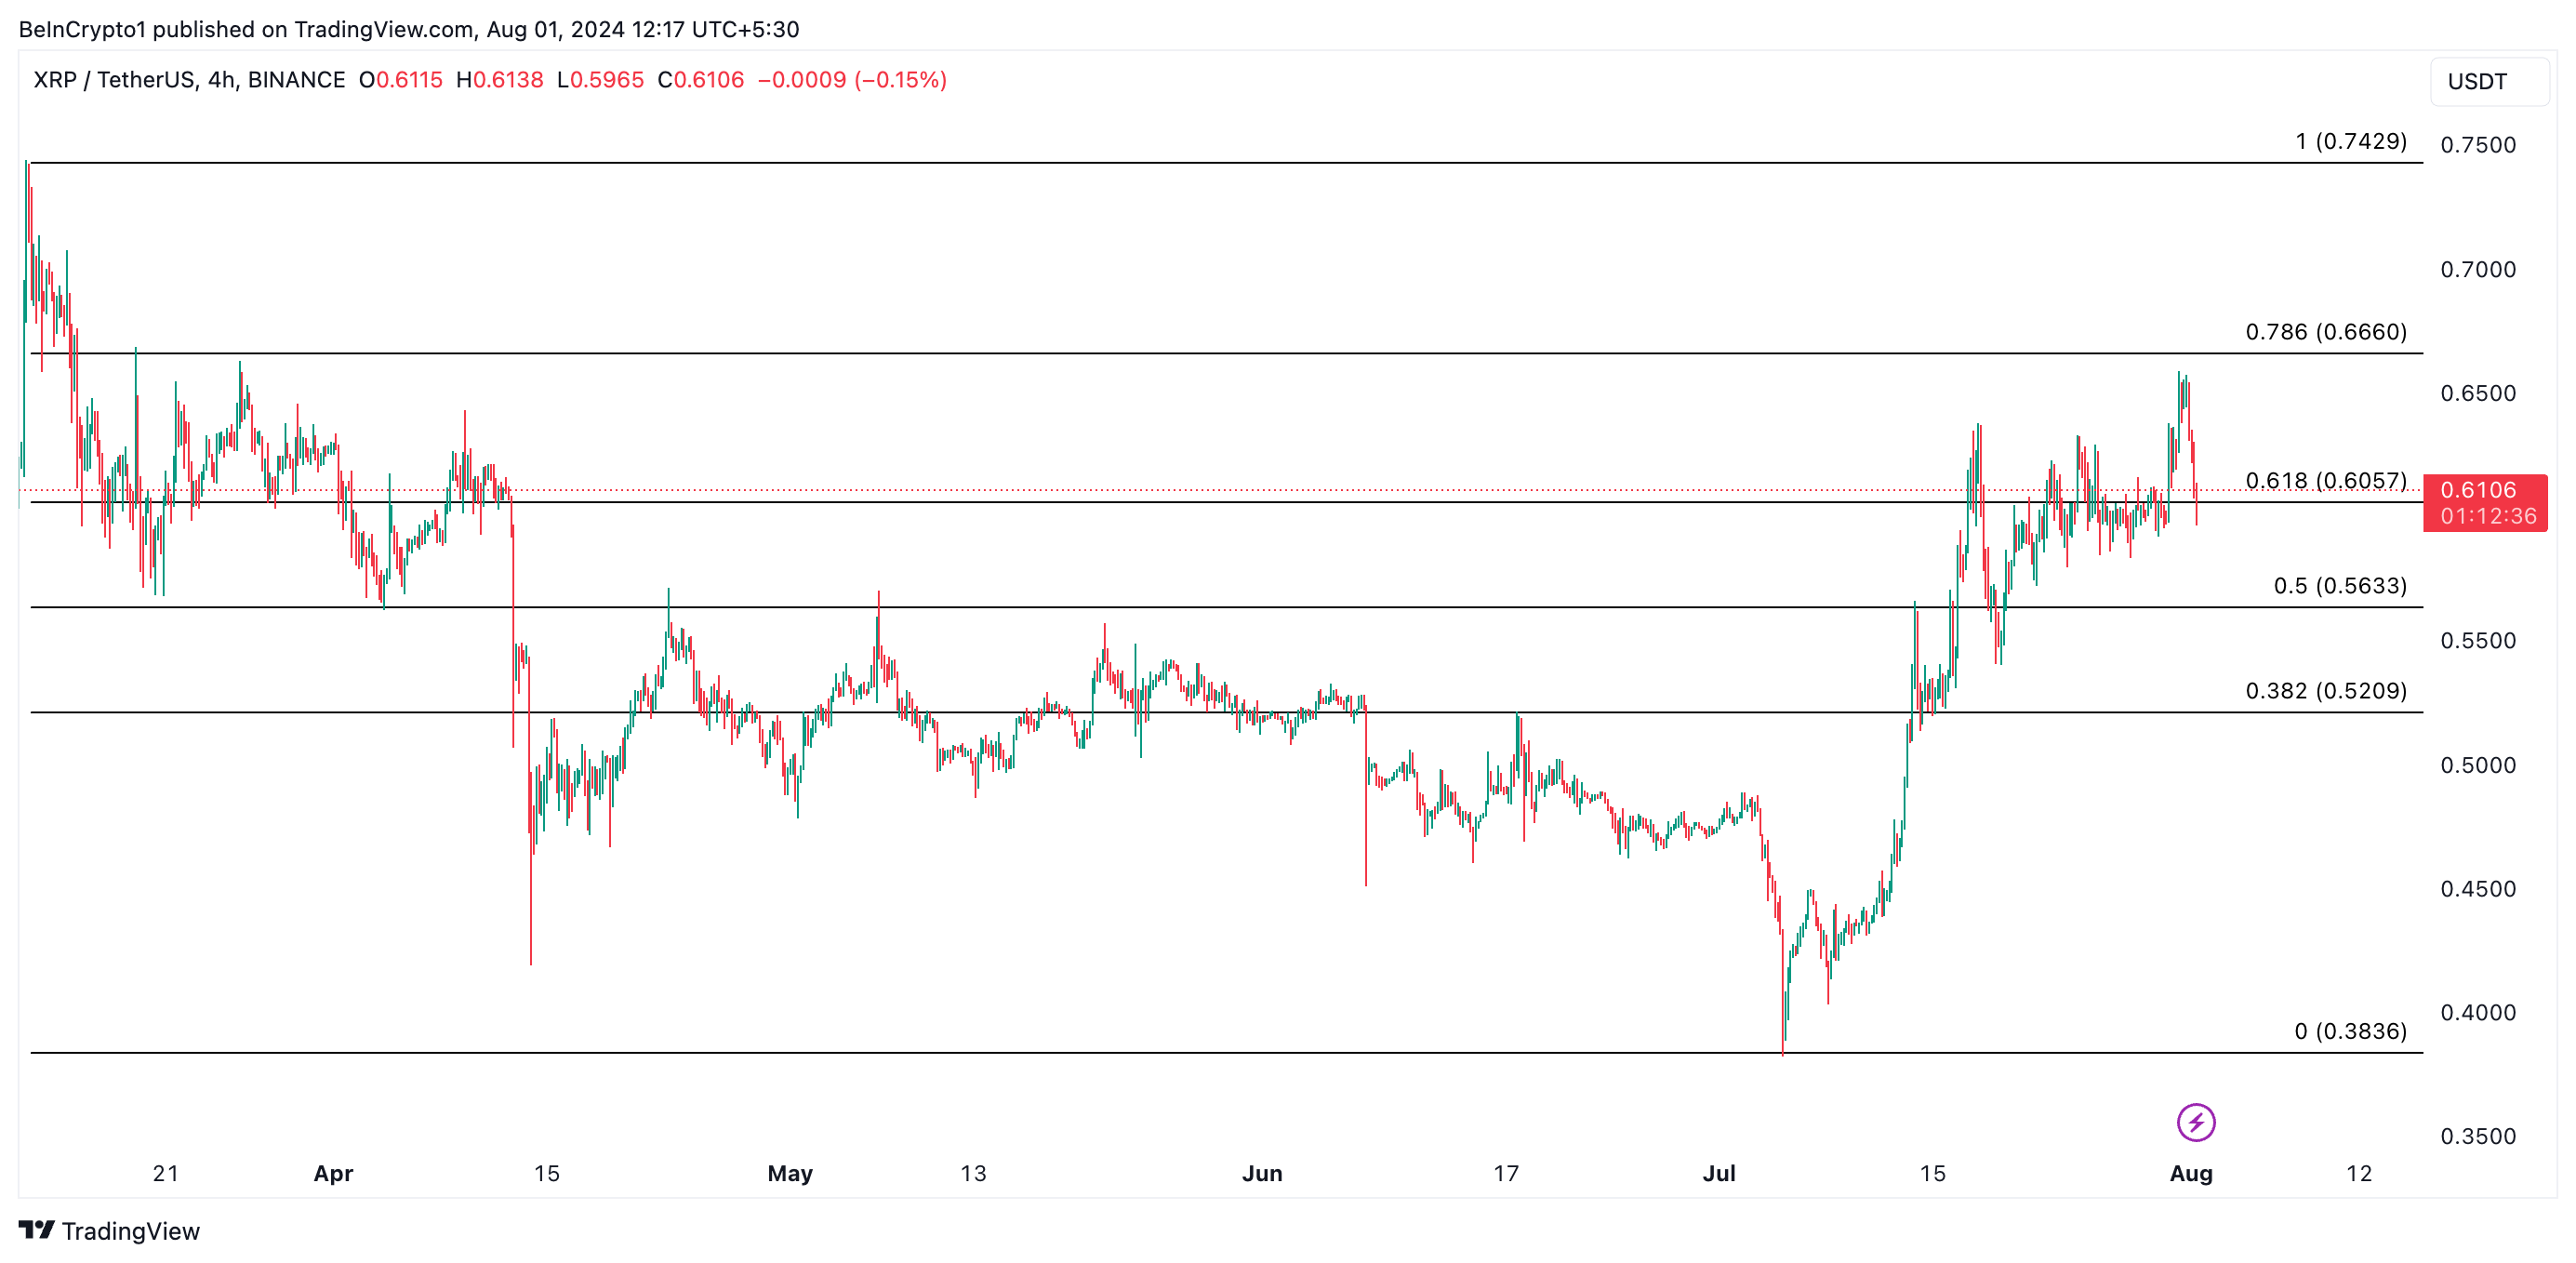
However, an assessment of XRP’s price movements on a 4-hour chart shows a spike in bearish bias as the market awaits the outcome of this crucial meeting. Its Moving Average Convergence/Divergence (MACD) indicator readings show that its MACD line (blue) has crossed below its signal line (orange).
XRP 4 Hours Analysis. Source: Trading View
Traders use this indicator to gauge price trends, momentum, and potential buying and selling opportunities in the market. When an asset’s MACD is set this way, it is a bearish signal that suggests selling activity is outweighing buying momentum.
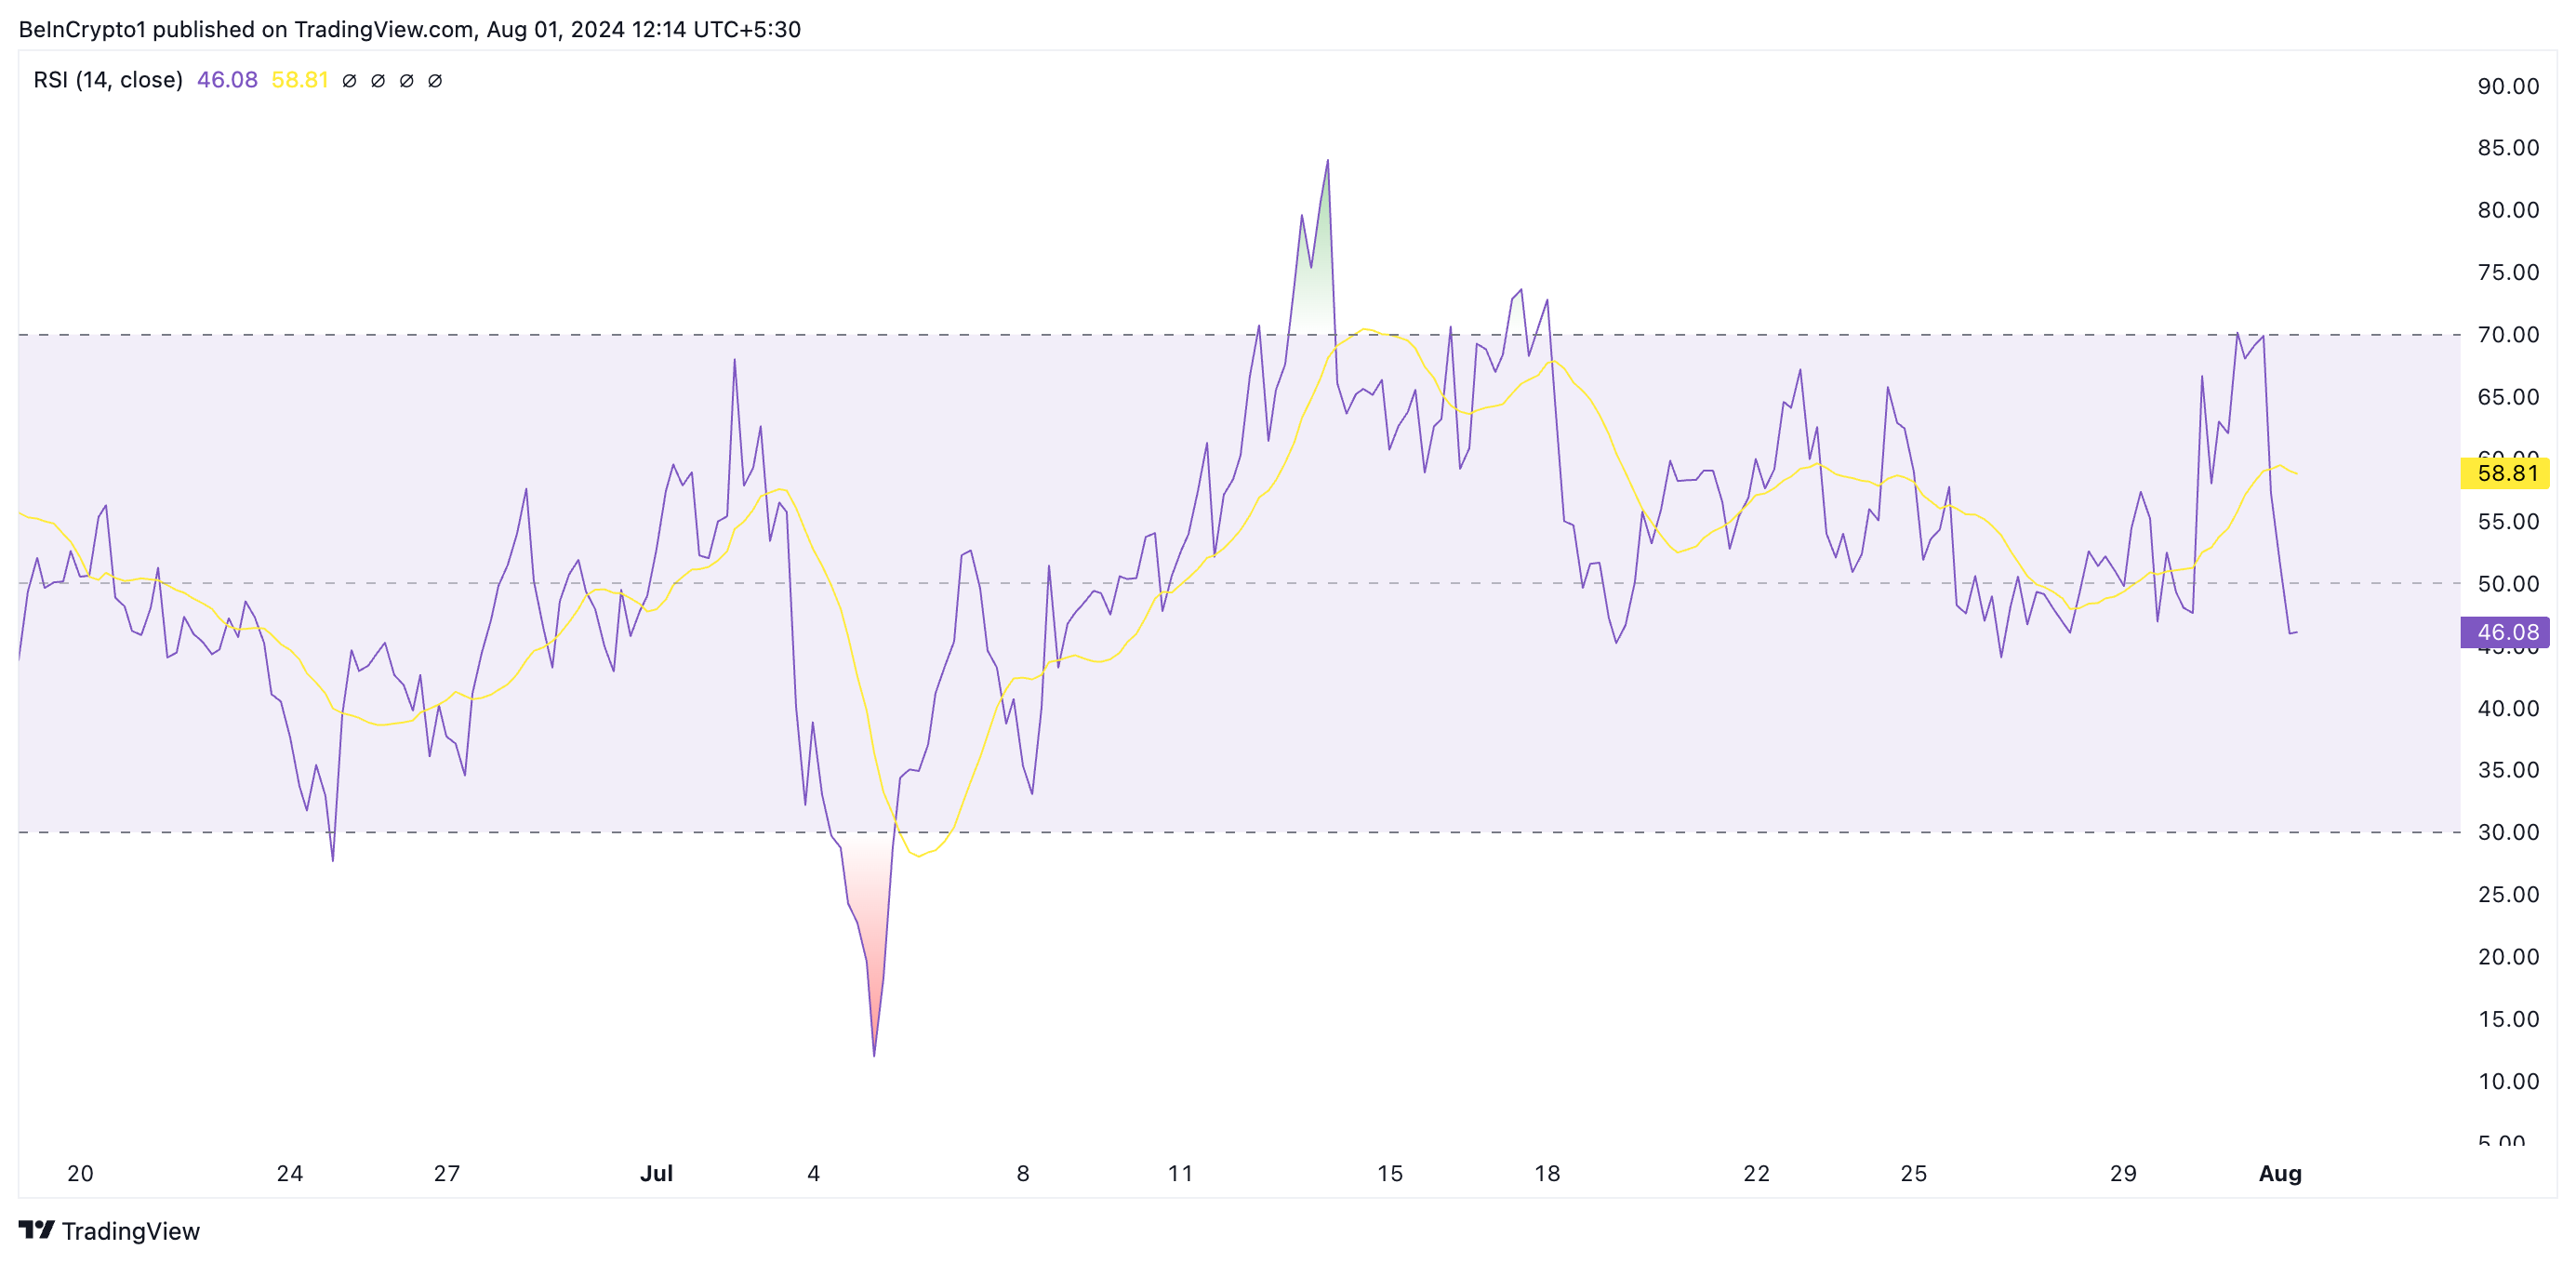
Additionally, the altcoin relative strength index (RSI), at 46.08, is currently below its neutral 50 line and in a downtrend. This indicator measures overbought and oversold market conditions for an asset.
To know more: How to Buy XRP and Everything You Need to Know
 XRP 4 Hours Analysis. Source: Trading View
At 43.83 at the time of writing, XRP’s RSI suggests a growing preference among the market participants for tokin distribution.
XRP Price Prediction: Derivatives Traders Exit Market
The XRP derivatives market has also seen a decline in trading activity over the past 24 hours. According to Coinglass, derivatives trading volume has plummeted 18% and open interest has dropped 10% during that period.
Open interest refers to the total number of outstanding derivative contracts, such as options or futurethat have not yet been resolved. When it drops, traders close their positions without opening new ones. This is a bearish signal that reflects a lack of confidence in any potential positive price movement.
According to Lee, the outcome of the meeting with the SEC “would have a significant impact on the price movement of the token.” If the outcome is favorable, the price of the token could rise towards $0.75 in August.
To know more: Ripple (XRP) Price Prediction 2024/2025/2030
 XRP 4 Hours Analysis. Source: Trading View
On the other hand, if no favorable resolutions are reached, the price could plummet to $0.50.
Disclaimer
In line with the Trust Project guidelines, this price analysis article is for informational purposes only and should not be considered financial or investment advice. BeInCrypto strives to provide accurate and unbiased reporting, but market conditions are subject to change without notice. Always conduct your own research and consult a professional before making any financial decisions. Please note that our Terms and conditions, Privacy PolicyAND Disclaimers They have been updated.

Bitcoin is now the dominant force in the cryptocurrency market, surpassing 53% of the total cryptocurrency market, a stronger share than it has been in the past three years.
Bitcoin’s market cap now stands at $1.27 trillion, second according to CoinGecko data. In contrast, the total cryptocurrency market cap is $2.43 trillion, with Ethereum occupying 15.9% of the market, worth $389 billion.
Bitcoin’s rise to dominance this year is unusual, as altcoins typically do better than Bitcoin in a bull market. While meme coins made a strong comeback during Bitcoin’s rally to all-time highs earlier this year, the so-called “wealth effect” It has not been appreciated as much by mid-range coins, such as Ethereum and Cardano.
“ETF flows fundamentally alter market dynamics,” he wrote Meltem Demirors, former chief strategy officer at CoinShares, tweeted Wednesday: “BTC gains no longer translate to alts and the longer tail of crypto.”
Bitcoin’s takeover has continued even as the market cap of Tether (USDT) continues to grow, the world’s largest stablecoin and the third-largest cryptocurrency after BTC and ETH. Stablecoins are backed by fiat currencies and are excluded from some measures of Bitcoin dominance due to fundamentally different value models.
The surge continued to pace even after the launch of Ethereum spot ETFs last week, which ironically culminated in a news sell-off event, and net outflows from new investment products since they were launched. This went against the predictions of K33 Search so far, which predicted that ETFs would catalyze ETH’s growth over the next five months.
Despite the poorer performance of the alts, there is reason to believe that they are ready to bounce back very soon.
CryptoQuant CEO Ki Young Ju said Tuesday that whales are “preparing for the next altcoin rally,” as limit buy orders for assets other than BTC and ETH are on the rise.
The executive shared a chart showing how the “cumulative difference between purchase volume and sales volume” has increased in recent months.
“The indicator measures the difference between buy and sell orders over a year,” CryptoQuant told Decrypt. A buy/sell order is a pre-set request to buy or sell a cryptocurrency if it hits a certain price level, which creates resistance and support levels.
“If the trend is up, it means that more people are placing buy orders, showing strong interest in buying,” CryptoQuant said.
By Ryan-Ozawa.
After Monday’s crash, in which BTC fell by several thousand dollars, the scenario has repeated itself once again in the last 12 hours, with the asset falling to a 2-week low of $63,300.
Alt coins followed suit, with most of the market in the red today. SOL and XRP lead the way from the higher cap alts.
BTC Drops To $63.3K
After a violent Thursday last week, when BTC crashed to $63,400, the asset went on the offensive over the weekend and surged above $69,000 on Saturday, as the community prepared for Donald Trump’s appearance at the 2024 Bitcoin Conference in Nashville.
His speech was followed by more volatility before the cryptocurrency settled around $67,500 on Sunday. Monday started off rather optimistically for the bulls as bitcoin hit a 7-week high of $70,000.
However, he failed to maintain his run and conquer that level decisively. On the contrary, he was rejected bad and dropped to $66,400 by the end of Monday. Tuesday and Wednesday were less eventful as BTC remained still around $66,500.
The last 12 hours or so have brought another crash. Bears have pushed the leading digital asset down hard, which has fallen to a 2-week low of $63,300 (on Bitstamp), leaving over $200 million in liquidations.
Despite the current rebound to $64,500, BTC’s market cap has fallen to $1.270 trillion, but its dominance over alts is recovering and has reached 52.6%.
Bitcoin/Price/Chart 01.08.2024. Source: TradingView
The Alts are back in red
Ripple’s native token has been at the forefront of the market challenge in recent days as pumped up to a multi-month high of over $0.66. However, its run was also interrupted and XPR fell by more than 6% in the last day to $0.6.
The other big loser among the larger-cap alternatives is SOL, which has lost 8% of its value and is now struggling to get below $170.
The rest of this altcoin cohort is also in the red, with ETH, DOGE, BNB, AVAX, ADA, SHIB, and LINK all seeing drops between 2 and 5%.
The total cryptocurrency market cap lost another $70 billion overnight, falling below $2.4 trillion today on CG.
Cryptocurrency Market Overview. Source: QuantifyCrypto SPECIAL OFFER (sponsored)
Binance $600 Free (CryptoPotato Exclusive): Use this link to register a new account and receive an exclusive $600 welcome offer on Binance (full details).
LIMITED OFFER 2024 on BYDFi Exchange: Up to $2,888 Welcome Reward, use this link to register and open a 100 USDT-M position for free!
Disclaimer: The information found on CryptoPotato is that of the authors cited. It does not represent CryptoPotato’s views on the advisability of buying, selling, or holding any investment. We recommend that you conduct your own research before making any investment decisions. Use the information provided at your own risk. See Disclaimer for more information.
Cryptocurrency Charts by TradingView.

“Prepare for a massive explosion top for Crypto in 2025” – Matt Hugan and Dan Tapiero

Michael Saylor – “The real Bitcoin Bull Run is about to start shortly”

“Bitcoin’s opportunity from $ 700x nobody sees arriving in 2025” – Willy Woo & Raoul Pal

Tom Lee – What I just discovered on the Bull Crypt market will shock you!

Jeff Booth – We made a 100% wrong on the bull market

Bitcoin soars above $63,000 as money flows into new US investment products

Ethena downplays danger of letting traders use USDe to back risky bets – DL News

FRA Strengthens Cryptocurrency Practice with New Director Thomas Hyun

Zodialtd.com to revolutionize derivatives trading with WEB3 technology

Bitcoin Fails to Recover from Dovish FOMC Meeting: Why?
“Prepare for a massive explosion top for Crypto in 2025” – Matt Hugan and Dan Tapiero
Michael Saylor – “The real Bitcoin Bull Run is about to start shortly”
“Bitcoin’s opportunity from $ 700x nobody sees arriving in 2025” – Willy Woo & Raoul Pal
Tom Lee – What I just discovered on the Bull Crypt market will shock you!
Jeff Booth – We made a 100% wrong on the bull market
-
 News11 months ago
Bitcoin soars above $63,000 as money flows into new US investment products
-
 DeFi11 months ago
Ethena downplays danger of letting traders use USDe to back risky bets – DL News
-
 News11 months ago
FRA Strengthens Cryptocurrency Practice with New Director Thomas Hyun
-
 DeFi11 months ago
Zodialtd.com to revolutionize derivatives trading with WEB3 technology
-
 Markets11 months ago
Bitcoin Fails to Recover from Dovish FOMC Meeting: Why?
-

 DeFi1 year ago
👀 Lido prepares its response to the recovery boom
-

 DeFi1 year ago
PancakeSwap integrates Zyfi for transparent, gas-free DeFi
-
DeFi1 year ago
🏴☠️ Pump.Fun operated by Insider Exploit
-

 Markets1 year ago
a resilient industry that defies market turbulence
-
DeFi1 year ago
👀SEC Receives Updated Spot Ether ETF Filings
-
DeFi1 year ago
🚀 S&P says tokenization is the future
-
DeFi1 year ago
⏱️ The SEC is not rushing the commercialization of Spot Ether ETFs